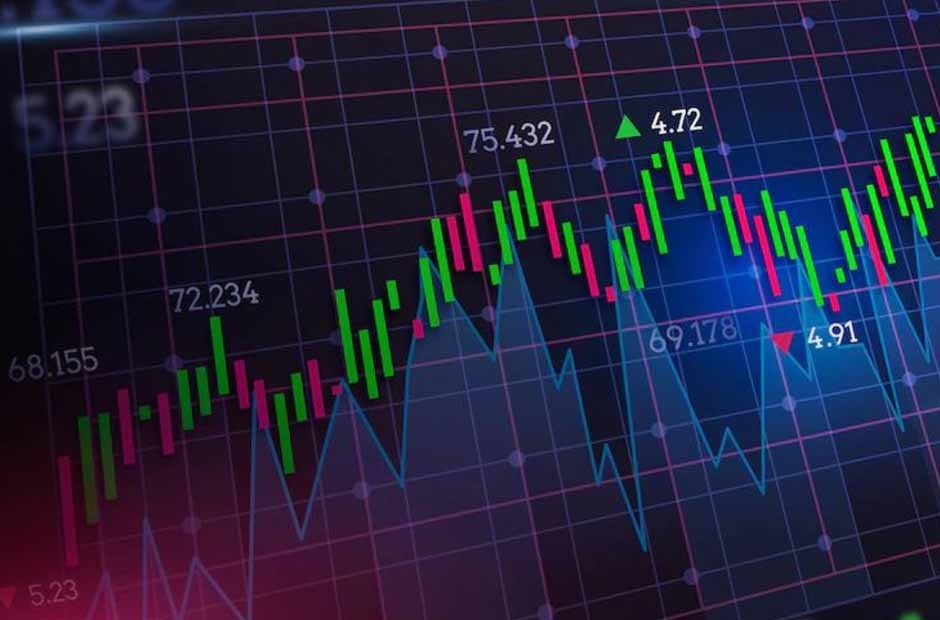
Cryptocurrency price charts provide valuable insights into the movement and trends of digital currencies.
Understanding how to read these charts can help traders make informed decisions and navigate the volatile world of cryptocurrencies effectively.
In today’s post, we will discuss the key elements of a crypto price chart and guide you on how to interpret them accurately. It is also worth noting that using reputable and respected sources such as Coin Watch is essential to making sure that you are getting accurate, up-to-the-minute information.
The Different Chart Types
Crypto charts come in different types; line charts, bar charts, and candlestick charts. Line charts provide a simplified view by connecting closing prices over time. Bar charts display the high, low, opening, and closing prices in a vertical bar format. However, the most commonly used chart type in cryptocurrency trading is the candlestick chart.
Candlestick charts offer a comprehensive representation of price action, displaying the open, high, low, and close for each period. Familiarize yourself with these different chart types to choose the most suitable one for your analysis.
Learning the Timeframes
Crypto prices can be viewed in various timeframes, ranging from minutes to years. Shorter timeframes, like 1-minute or 5-minute charts, provide granular details about price movements in real time. Longer timeframes, such as daily, weekly, or monthly charts, offer a broader perspective on price trends. It’s important to select the appropriate time frame based on your trading style and objectives.
Price and Volume
The price axis of a crypto chart represents the value of the cryptocurrency being analyzed. The vertical axis displays the price levels, while the horizontal axis represents the corresponding time periods. Understanding the price movements is crucial for identifying patterns, trends, and support/resistance levels.
Volume, depicted usually as a bar chart beneath the price chart, reflects the number of coins or tokens traded during a given period. Analyzing volume can help confirm the strength of price movements and identify periods of increased buying or selling pressure. Quality sites like Coin Watch have tools and info to assist crypto enthusiasts with these indicators.
Support and Resistance Levels
Support and resistance levels are key concepts in technical analysis. Support levels are price levels where buying pressure is expected to outweigh selling pressure, potentially leading to a price rebound.
Resistance levels, on the other hand, represent price levels where selling pressure is expected to surpass buying pressure, possibly causing a price drop. By identifying these levels on a chart, traders can make decisions about entering or exiting trades, setting stop-loss orders, or taking profit.
Indicators and Patterns
Crypto charts offer a wide range of indicators and patterns that can provide valuable insights into market trends. Indicators such as relative strength index (RSI) and moving averages (among many others) can help identify overbought or oversold conditions and potential trend reversals. Additionally, chart patterns like triangles, wedges, head and shoulders, and double bottoms can offer clues about future price movements.
Finding Trustworthy Sources to Chart Crypto Prices
Reading crypto charts is an essential skill for any cryptocurrency trader or investor. By using a reputable site as your source and understanding the different chart types and how to read them, you can gain valuable insights into market trends and make informed decisions.


